We worked with the City of New Haven, Connecticut, to prepare for and respond to Superstorm Sandy a few weeks ago. This post is Part 3 in a series in which we discuss our experiences and what we learned as we helped New Haven through this crisis.
The City of New Haven, by all accounts, came through Superstorm Sandy with a smooth and efficient response. This was the first time the City used Veoci to manage the response to a significant weather event. Usage during Sandy showed the value that SaaS software such as Veoci, easy to use and requiring little or no training, can bring to organizing the various teams deployed after the hurricane. This post is the first of a series of how New Haven leveraged Veoci to respond to Sandy.
During an emergency, people call the EOC or 911 to report incidents that affect their home or their street and neighborhood. It is not unusual to reach a rate of perhaps ten times the normal volume: as much as 10 calls per 1000 population for a significant weather event; when a hurricane strikes, one in hundred people may make the phone call. For a city of one million, that is 10,000 phone calls and a peak rate of 1,000 per hour.
Clearly, the Public Safety Acces Point (PSAP) or 911 does not have the people to handle this large volume of calls – in addition to the normal 911 calls they receive. Typically, PSAPs receive five calls per hour per 100,000 of population. During Sandy the peak number of calls for New Haven in one hour was 80 – over ten times the normal volume. Personnel from other functions are drafted to take these calls and the usual method was to write down each call on a paper form and hand it off to someone who can then take the required action.
Introducing Spreadsheets
Many communities have tried using spreadsheets – Excel or even Google docs where the spreadsheet can be shared on-line. Spreadsheets have a few basic advantages: they are widely available, people know how to use them, and they are easy to setup and modify during the course of an emergency.
The usual method is for call-takers to and write on forms and the hand written forms are transferred to a spreadsheet and the file is shared periodically via email or printed and faxed. While this is an improvement over the paper, it still introduces a additional step where both delays and errors are possible. The recent usage of Google docs where a spreadsheet is shared and can be viewed live by many people provides some advantages over Excel but the lack of familiarity and reduced performance have been hurdles. In any case, printing data from spreadsheets for reporting purposes may not be a practical solution as the data keeps changing during an emergency.
Web Forms
The hurdles faced with spreadsheets and with the PSAP systems can be resolved with Veoci Tasks. The Veoci tasks include a form feature to create fields required for the Task. The Task-form feature in Veoci is as easy as creating a spreadsheet to setup and takes as little time. Even after it is set up and data loaded, it can be modified. The task-form also includes location and address fields that link to a Google maps view of the data entry. Once setup, hundreds of people can sumultaneously access the Task-form, enter or modify data and submit the form.
During Sandy, the City of New Haven setup a Task-form for the call responders to log the calls they received. The setup was done on Sunday before the storm arrived on Monday. The discussion on what should be in the Task-form took some time – the setup on the system took less than fifteen minutes. The Task-form also included a highlighted and formatted area with specific instructions for the call takers; these clear instructions allowed the call takers to start using Veoci without any formal training.
Tracking Incidents with Filtered Views
As the task requests were submitted into Veoci, the next step was to analyze the data and assign the tasks to the various teams including the local utility, United Illuminating.
Data in Veoci can be viewed and analyzed using a spreadsheet-like grid or on a geographical map. The multiple agencies operating from the EOC used the grid-views with specific filters extensively. For example, the fire department was able to create a snapshot of all the incidents that needed their attention. Similarly, the utilities company and the parks & recreation teams were able to create a view with specific filters that required their response. Once created, the filters could be bookmarked as URLs and invoked when needed.
Tracking Incidents on a Geographical Map
â€
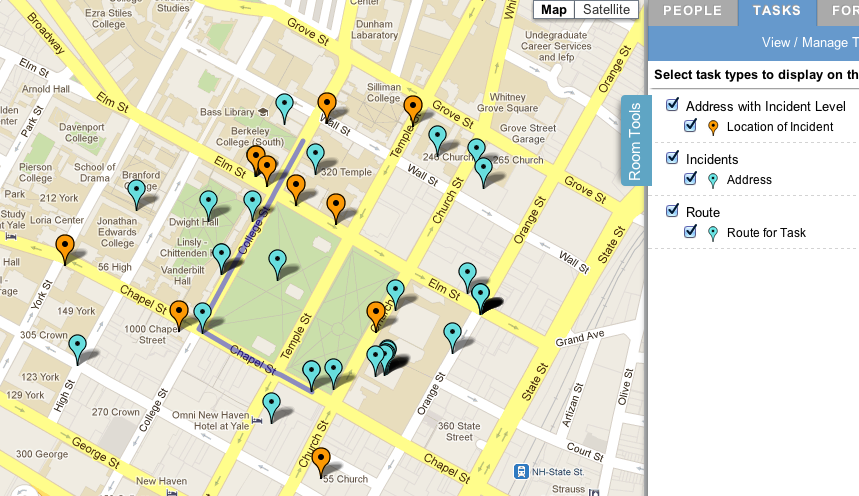
With increase in the number of incidents came the need to analyze patterns and group incidents by location. With Veoci, the decision makers at the EOC saw a real-time of the incidents as they were logged in the task-forms by the call takers. While most call-takers types in the addres given to them on the phone call, a few call takers also used the Veoci functionality to drop a pin on the map and create a task-form for that location.