
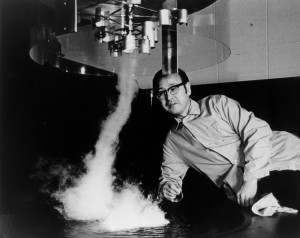
Tornado intensity is classified on the Fujita Scale – named after Dr. Ted Fujita (aka Dr. Tornado) who in 1971 developed a rating methodology.
While Dr. Fujita originally used estimates of wind measurements to rate tornadoes, the current method, the Enhanced Fujita (EF) Scale, uses the degree of damage to rate them; the wind speed is an estimate based on observed damage. For historical tornadoes, photos and description of damage are used to estimate their rating.
The EF rating system is thorough and correlates very well with cases where wind speed measurements are available. The current EF scale uses 28 Damage Indicators – objects, such as small barns and high-rise building, free standing light poles and types of trees. For each of these Damage Indicators it also establishes the description of degree of damage – from visible damage to total destruction. An aerial or ground survey of the damage identifies the Damage Indicators and the EF rating for the item from the degree of damage for the Damage indicators. The EF-scale rating of the tornado is based on the maximum EF rating observed for the damage indicators.
The chart below, from the United States National Oceanographic and Atmospheric Agency (NOAA), shows Dr. Fujita’s classifications and the current operational Enhanced Fujita Scale.
F Number Fujita Scale
Fastest 1/4-mile (mph)
3 Second Gust (mph)
EF Number Derived EF Scale
3 Second Gust (mph)
EF Number Operational EF Scale3 Second Gust (mph)
0
40-72
45-78
0
65-85
065-85
1
73-112
79-117
1
86-109
1 86-110
2
113-157
118-161
2
110-137
2111-135
3
158-207
162-209
3
138-167
3136-165
4
208-260
210-261
4
168-199
4166-200
5
261-318
262-317
5
200-234
5Over 200
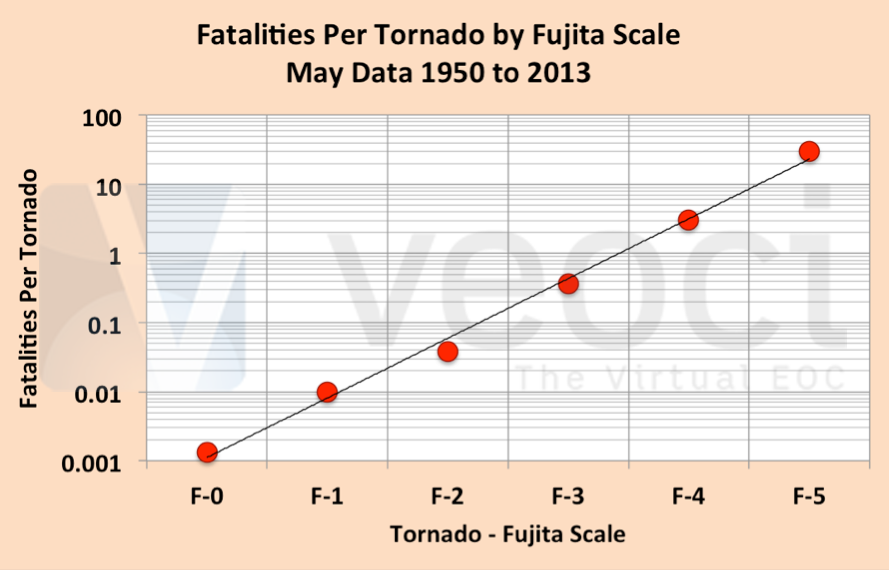
The elegance of the Fujita Scale is evident in the chart below where the average number of fatalities per tornado for every May from 1950 to 2013 against their EF ratings are plotted – it’s a straight line. The number of fatalities correlates precisely with intensity on the Enhanced Fujita Scale. The scale is logarithmic with intensity going up by a factor of ten each time. Apparently, while tornadoes from EF0 to EF3 have minimal fatalities, clearly EF5 tornadoes cause many deaths and should earn special attention.
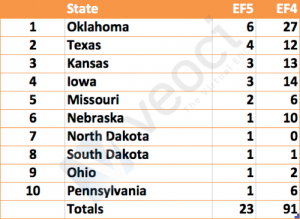
The Ten states that have experienced EF5 tornadoes during the month of May in the last 64 years are listed here. The ten states include 55 counties. Perhaps not surprisingly, Oklahoma tops the list.
Six counties have experienced two EF5 tornadoes in May over this same period:
Iowa: ButlerOklahoma: Kay, Sumner, McLain & Cleveland
Texas: McLennan
References:
1. “A Recommendation for an Enhanced Fujita Scale (EF Scale)”, Wind Science and Engineering Center, Texas Tech University, Lubbock, Texas 79409. Principal Investigators: Drs. James R. McDonald and Kishor C. Mehta. Research performed under Department of Commerce NIST/TTU Cooperative Agreement Award 70NANB8H0059. Dr. Jim St. Pierre, project administrator, and Dr. Emil Simiu, technical oversight. http://www.spc.noaa.gov/faq/tornado/ef-ttu.pdf
2. The data here are taken from excellent resource for Tornadoes: The Tornado History Project a free, searchable database of all reported U.S. tornadoes from 1950-2013*. There are over 53,000 tornadoes currently in the database, each with its own map and forum. The project’s main goal is to combine historical data with user submitted items (eyewitness memories, photos, videos, etc…) to recreate the history of as many tornadoes as possible. Joshua Lietz conceived and developed the Tornado History Project. http://www.tornadohistoryproject.com/about
3. Dr. Ted Fujita photo credit: NOAA