Hurricane Katrina made landfall on the gulf coast around the Mississippi-Louisiana border in the early morning hours of August 29, 2005 as a strong Category 3 Hurricane with an unusually large size – hurricane force winds across a path 240 miles wide.
The damage was catastrophic.
Considering the impact it had on the national consciousness, Hurricane Katrina was perhaps the defining natural catastrophe for the generation. By comparison, the last hurricane with this magnitude of damage was the, the deadliest weather disaster in United States history. Hurricane Sandy from October 2012 is well on its way to becoming the second costliest Hurricane after Katrina; while the data is still being finalized it is currently estimated at 286 fatalities and $65 billion in damage.
NOAA, FEMA, and various governmental and non-governmental entities have all done considerable work in looking back to understand the hurricane, its impact on people and property, and glean lessons for the future. Their efforts are reflected in data now in firm shape and making its way into the history books.
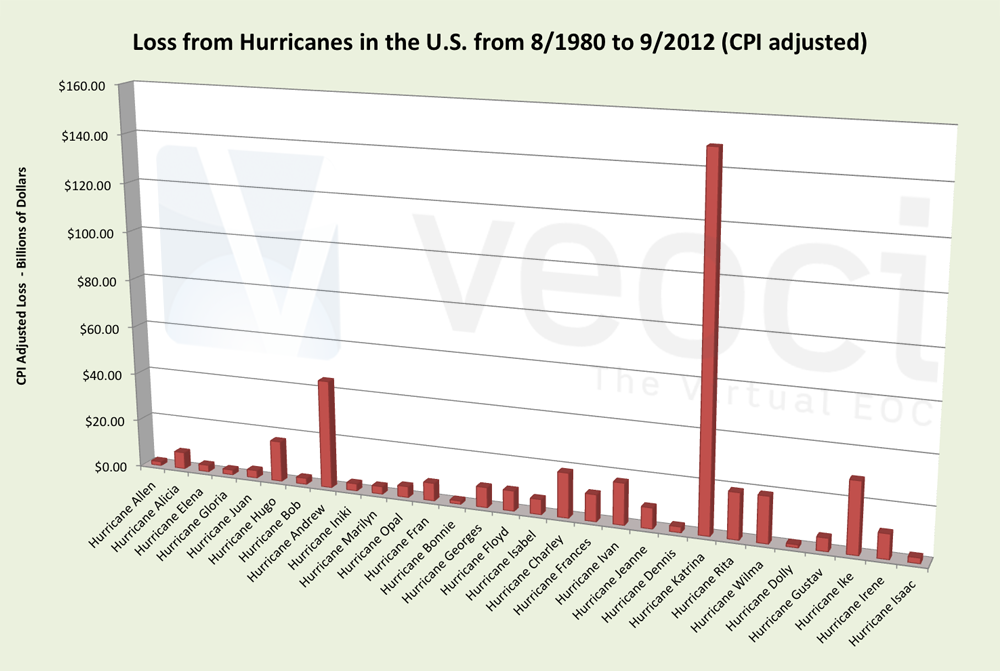
FEMA also keeps records of the damage done by the disasters. They have a table of “Billion Dollar Disasters” – disasters that cause a loss of over a billion dollars (consumer price index adjusted). The data is from 1980 to 2012.
We took this data and produced two graphs for the damage done by hurricanes; it makes clear why Hurricane Katrina is in a league of its own.
Damage in billions of dollars:
- Hurricane Katrina: $148.8 billion
- Average for 28 hurricanes with damage of $1B or more: $9.6 billion.
Lives Lost:
- Hurricane Katrina: 1,833
- All other 28 hurricanes combined: 1,071
Even among the “billion dollar” disasters, Katrina stands out. It remains both an outlier and a benchmark for understanding the extent of damage and loss of life that a hurricane can cause, and an unrivaled impetus for improving preparedness and resiliency efforts.


